
Dr Limeng Ni
Product Manager,
Materials Physics
and Measurement

Dr Abi Graham
Senior Measurement Scientist
Last summer, we wrote about why we built TeslatronPT Plus the way we did. The central idea was straightforward: researchers using low temperature and cryogenic measurement systems should be spending their time on science, not on managing software, chasing instrument connections, or worrying about whether their data has been saved correctly.
You may be an experienced laboratory head and Principal Investigator who needs to manage the onboarding of new PhD students and post-docs. Or maybe you are starting up your own lab for the first time and just need to reduce the number of things to worry about. Either way, our TeslatronPT Plus system architecture is here to support you and ease those journeys.
The TeslatronPT Plus is an open-architecture, low temperature measurement system designed to automate cryogenic experiments and simplify data acquisition for quantum and materials research. We have released new software updates for DECS, Measurement Server Administration (MSA) and measurement scripts for TeslatronPT Plus throughout the year. These cover everything from cooling your system down to collecting and visualising your measurement data. Here's what's new, and what it means in practice for the people using the system every day.
One of the most common sources of frustration in cryogenic research is uncertainty. Is the system ready? Is the cooldown still running? Did something go wrong overnight? Until now, answering those questions often meant checking multiple readings and making a judgement call.
The DECS software for the TeslatronPT Plus addresses this by monitoring your system continuously and showing you clearly what state it is in – whether that is warming up, cooling down, sitting cold and ready to measure, or anything in between. You don't have to interpret pressure gauges and temperature readings yourself. DECS does it for you and keeps you informed.
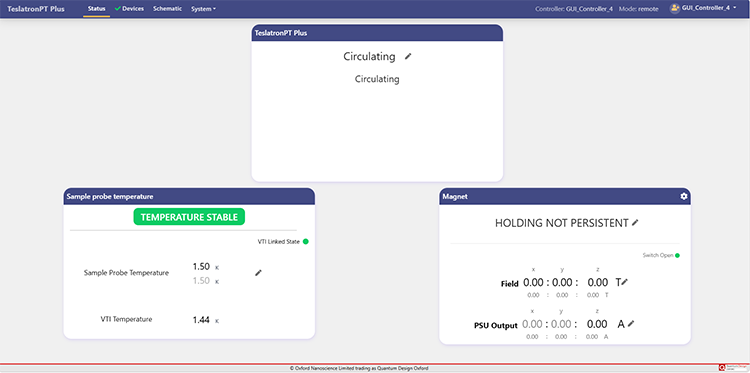
Fig. 1: The Status tab displays the current system status
The most time-consuming parts of running a cryogenic system, getting it cold and getting it back to room temperature, are automated. You start the process, and the software handles the sequence of steps that follows. That means fewer things to remember, fewer opportunities for something to be done out of order, and more consistent results from one run to the next.
If you need to stop a cooldown partway through, perhaps because of an unexpected schedule change or a problem with a sample, there's a dedicated routine in DECS for that too. Rather than improvising, you run the "Abort" sequence and the system returns to a safe, stable state in a controlled way.
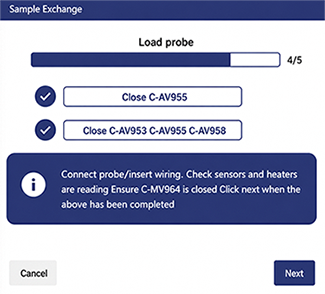
Fig. 2: Guided sample exchange process
Routine maintenance like cleaning the sample space or exchanging a probe has always required careful attention to procedure. The latest DECS releases include guided wizards for these tasks: the software walks you through each step in sequence, so there's less reliance on printed instructions or institutional memory.
This is particularly useful in group settings, where PhD students or newer lab members may be performing these procedures for the first time, or where the person who usually handles maintenance isn't available. The knowledge is in the software, not just in people's heads.
Previously, managing temperature and magnetic field meant working across different parts of the interface. Both are now accessible from a single screen in DECS. If you need to move between temperature setpoints and you want to get there faster, a high-flow mode lets you increase cooling speed where the measurement allows it. Fewer steps, fewer windows, more time spent on the experiment itself.
Managing a shared research system can quietly become a significant overhead. Adding a new user, connecting a new instrument, working out what version of a software package is installed – these are small tasks individually, but they add up, and they often fall on whoever knows the system best.
Measurement Server Administration (MSA) is a new browser-based tool that pulls all this together in one place. Anyone on the team can open it from their laptop or desktop and see what's running, which instruments are connected, and how to get to Jupyter, Grafana, or the cryostat control software. No installation required, no VPN fiddling – just a web page on the lab network.
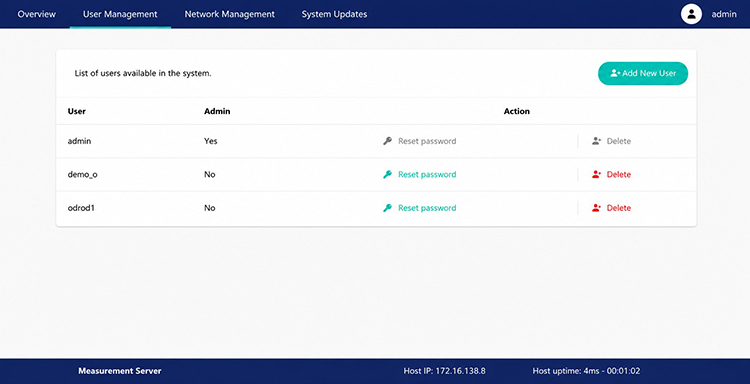
Fig. 3: Measurement Server Admin (MSA)
Not everyone needs to change system settings. MSA separates everyday users from administrators, so the team members who just need to run measurements can get on with it, while the people responsible for maintaining the system have the controls they need. Administrators can add and remove users, manage instrument connections, and push software updates – all through the same interface.
Connecting a new measurement instrument to the lab network and making sure everything can find it used to involve hunting through network configuration files. MSA gives administrators a straightforward interface for assigning fixed addresses to instruments and applying the changes. Instruments supplied by Quantum Design Oxford come pre-configured and are visible in MSA from day one.
Anyone who's worked with Grafana for live data dashboarding knows that getting a new data source connected can be a manual process. With MSA, that step disappears. Any measurement database saved in the standard location is automatically available in Grafana. Your new experiment shows up ready to plot without any extra work.
Getting a new researcher productive on a cryogenic measurement system takes time. They need to understand the instrument, set up their measurement scripts, and figure out how to store and visualise their data. Each of those steps is an opportunity for delay.
The TeslatronPT Plus template scripts are designed to compress that ramp-up time. They're a collection of ready-to-use Jupyter notebooks, each one set up to run a standard electrical transport measurement from start to finish. Open the notebook, adjust the parameters for your experiment, and run it. The connection to the cryostat, the instrument control, the data storage – it's all already handled.
These templates are particularly useful for quantum materials research, superconductivity studies, and electrical transport measurements at low temperature.
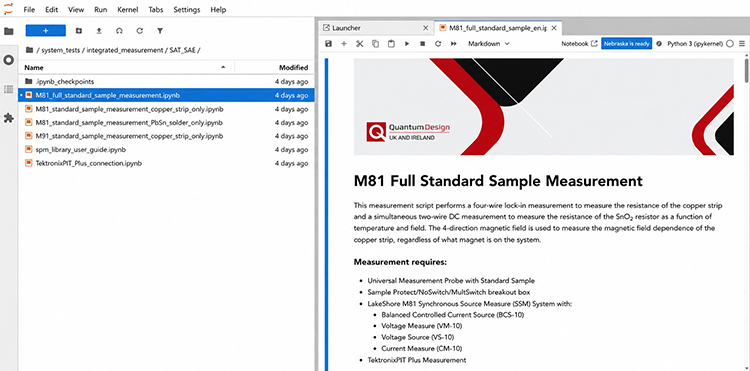
Fig. 4: Template measurement scripts
Every measurement notebook comes with a matching Grafana dashboard. As your experiment runs, you can watch the data appear in real time – field sweeps, temperature dependence, resistance as a function of whatever variable you're controlling. You don't need to wait until the measurement is finished to see what's happening.
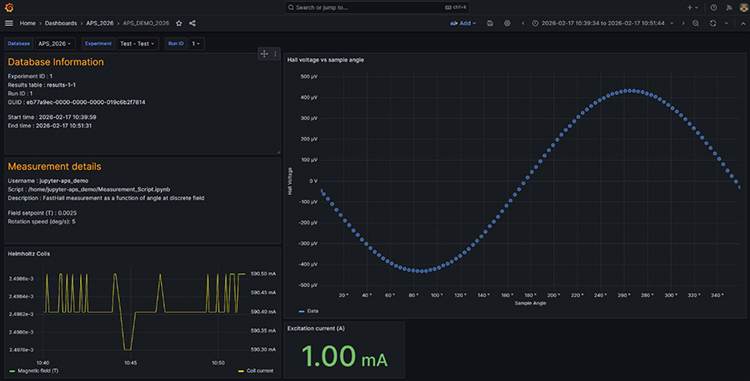
Fig. 5: Measurement data visualisation in Grafana
The templates are written in standard Python and designed to be modified. If you need to add a step, change a parameter sweep, or integrate an instrument that isn't in the default setup, you can. An example script for a Keithley 2450 source-measure unit is included to show how third-party instruments can be brought in alongside the standard Lake Shore M81 and M91 hardware.
Data can be stored in shared databases with controlled access, making collaboration across teams much easier. Team members can contribute to data analysis, explore results, and create visualisations – all from the same Jupyter interface. This means work doesn't have to stay with one person; measurements started by one team member can be easily picked up, continued, and expanded by others, helping teams work more efficiently and share knowledge seamlessly.
When data needs to be shared beyond the immediate team, flexible export options make the process straightforward. Built-in export scripts support a range of formats, and for quick access, CSV files can be downloaded directly from Grafana dashboard plots, making it easy to move insights wherever they're needed.
Taken together, these recent releases and the template scripts mean that a TeslatronPT Plus low temperature measurement system is now an even more self-contained, manageable research environment.
A new researcher joining your group can get from zero to running a measurement in significantly less time than before. An experienced researcher can move through cool-downs, measurements, and warm-ups with less manual effort and more confidence that each step is being done correctly. And the person responsible for keeping the system running has a single place to manage users, instruments, and software.
We think that all adds up to meaningfully more time spent on the science that matters!
To find out more or to speak with us about your system:
Contact UsCopyright © 2026 Quantum Design Oxford