Delivered as an add-on to our control software DECS, the Measurement Extension brings your complete measurement workflow into one integrated environment. Move seamlessly from automated data acquisition and real-time visualisation to analysis, data export and the preparation of publication-ready reports. Currently available with our TeslatronPT and TeslatronPT Plus measurement systems, this extension facilitates cryostat control, instrument management, editable measurement templates and more, to provide users with a complete, automated solution for cryogenic measurement experiments.
Find out how you can benefit from the latest features available with the newest Measurement Extension release.
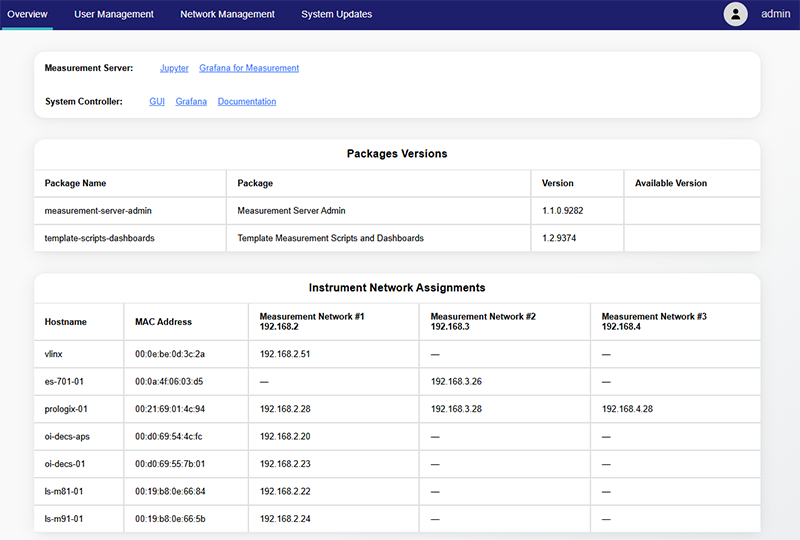
Manage your shared measurement environment through one browser-based interface with the Measurement Server Administration package within the Measurement Extension. View connected instruments and running services, manage users and permissions, and access DECS, JupyterHub and Grafana - all without installing software locally.
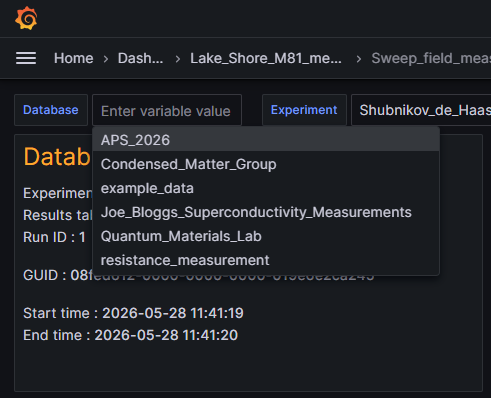
Start measuring faster with editable Jupyter notebooks for common electrical transport experiments. Instrument connections, automated data acquisition and data storage are already configured – simply set your parameters and run. Matching Grafana dashboards visualise your data live, allowing you to monitor results as the experiment progresses.
Adapt the software to your research rather than adapting your research to the software. Modify the supplied Python scripts and Grafana dashboards or create entirely new workflows, integrate additional instruments and design experiments without being limited to predefined measurement types.
Keep scripts, datasets, metadata and dashboards accessible within one shared environment. Permission-controlled databases allow researchers to securely share results, reproduce experiments and build on colleagues' work – simplifying handovers, onboarding and knowledge transfer.
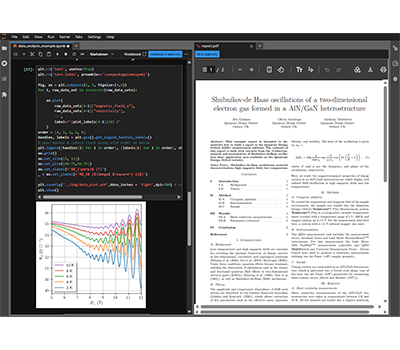
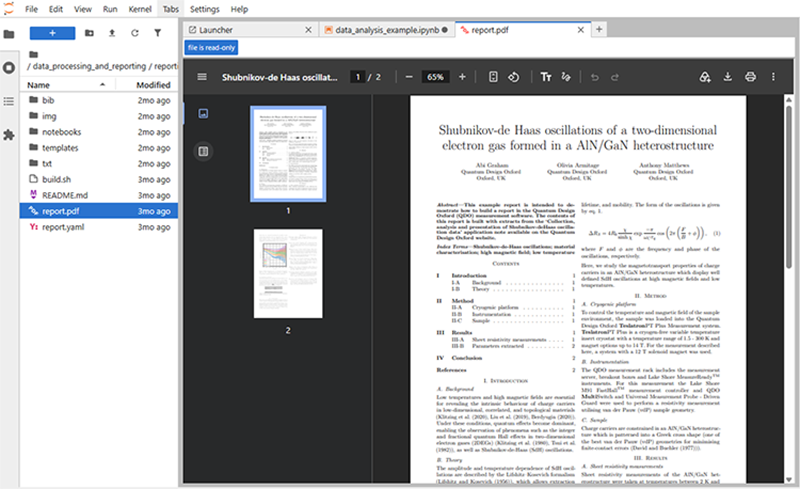
Analyse data where it is acquired, eliminating manual transfers between separate applications. Use your preferred Python packages, batch-process multiple datasets and their metadata, and create publication-ready reports with Markdown and LaTeX – all within the same environment.
For additional product information:
Contact Our Sales TeamCopyright © 2026 Quantum Design Oxford